From time to time, I was thinking about how to generate an organizational hierarchy with the Graph API. Visualization of the organizational structure makes it easier to identify relationships between users inside the organization.
Thanks to the Graph API, getting relationships between users is easy. The challenge is how to visualize relationships between managers and users.
My idea was to find a simple way for describing the relationships between users inside the organization and let some tool generate a chart for me. I've decided to try the markmap.
Markmap
Markmap is a combination of Markdown and mindmap. It parses Markdown content and extracts its intrinsic hierarchical structure and renders an interactive mindmap, aka markmap.
The easiest way to use the markmap is to load your Markdown content into the demo page.
Another option is to use the markmap command line tool
$ npx markmap-cli markmap.md
or if you want to install the package
$ npm install -g markmap-cli
$ markmap markmap.md
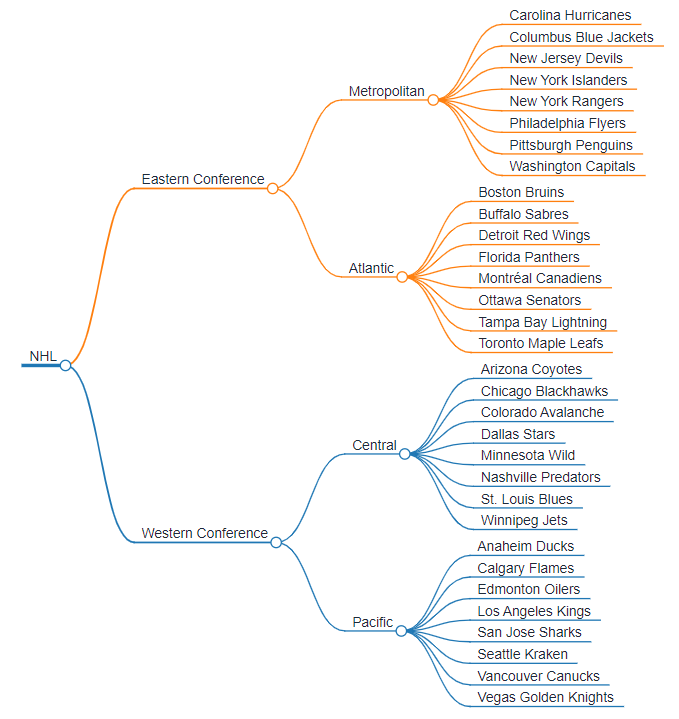
Example of the Markdown file
---
markmap:
  colorFreezeLevel: 2
---
# NHL
## Eastern Conference
### Metropolitan
- Carolina Hurricanes
- Columbus Blue Jackets
- New Jersey Devils
- New York Islanders
- New York Rangers
- Philadelphia Flyers
- Pittsburgh Penguins
- Washington Capitals
### Atlantic
- Boston Bruins
- Buffalo Sabres
- Detroit Red Wings
- Florida Panthers
- Montréal Canadiens
- Ottawa Senators
- Tampa Bay Lightning
- Toronto Maple Leafs
## Western Conference
### Central
- Arizona Coyotes
- Chicago Blackhawks
- Colorado Avalanche
- Dallas Stars
- Minnesota Wild
- Nashville Predators
- St. Louis Blues
- Winnipeg Jets
### Pacific
- Anaheim Ducks
- Calgary Flames
- Edmonton Oilers
- Los Angeles Kings
- San Jose Sharks
- Seattle Kraken
- Vancouver Canucks
- Vegas Golden Knights
and its visualization

Organizational structure
When enumerating users in the Graph API, you can use the $expand query parameter to return a manager for the users:
GET /users?$expand=manager
To return only specific properties of the manager, use nested $select:
GET /users?$expand=manager($select=id,displayName)
Solution
Let's combine all together and create a simple application that uses the Graph .NET SDK to generate a markdown file with the organization structure.
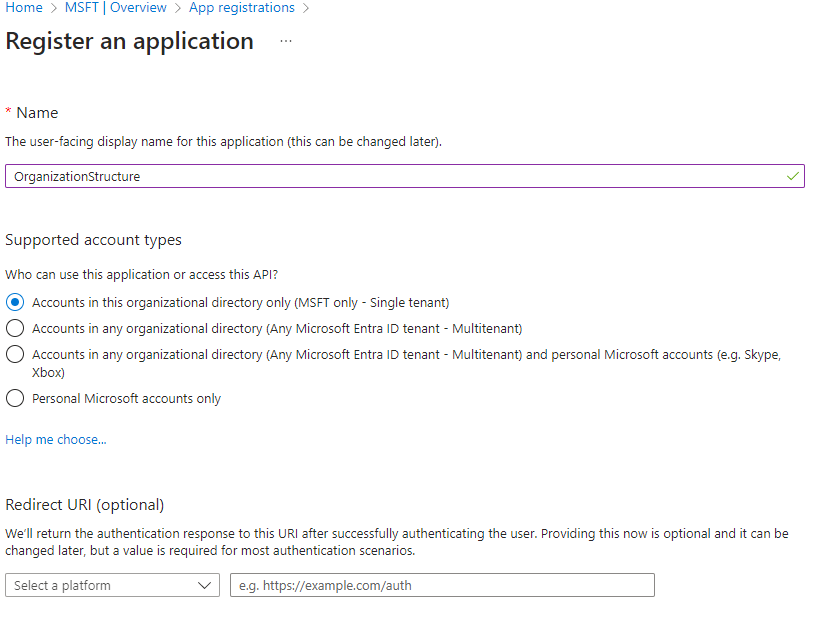
Create an application in Azure AD
- Register an application in Azure AD

- Create a new client secret

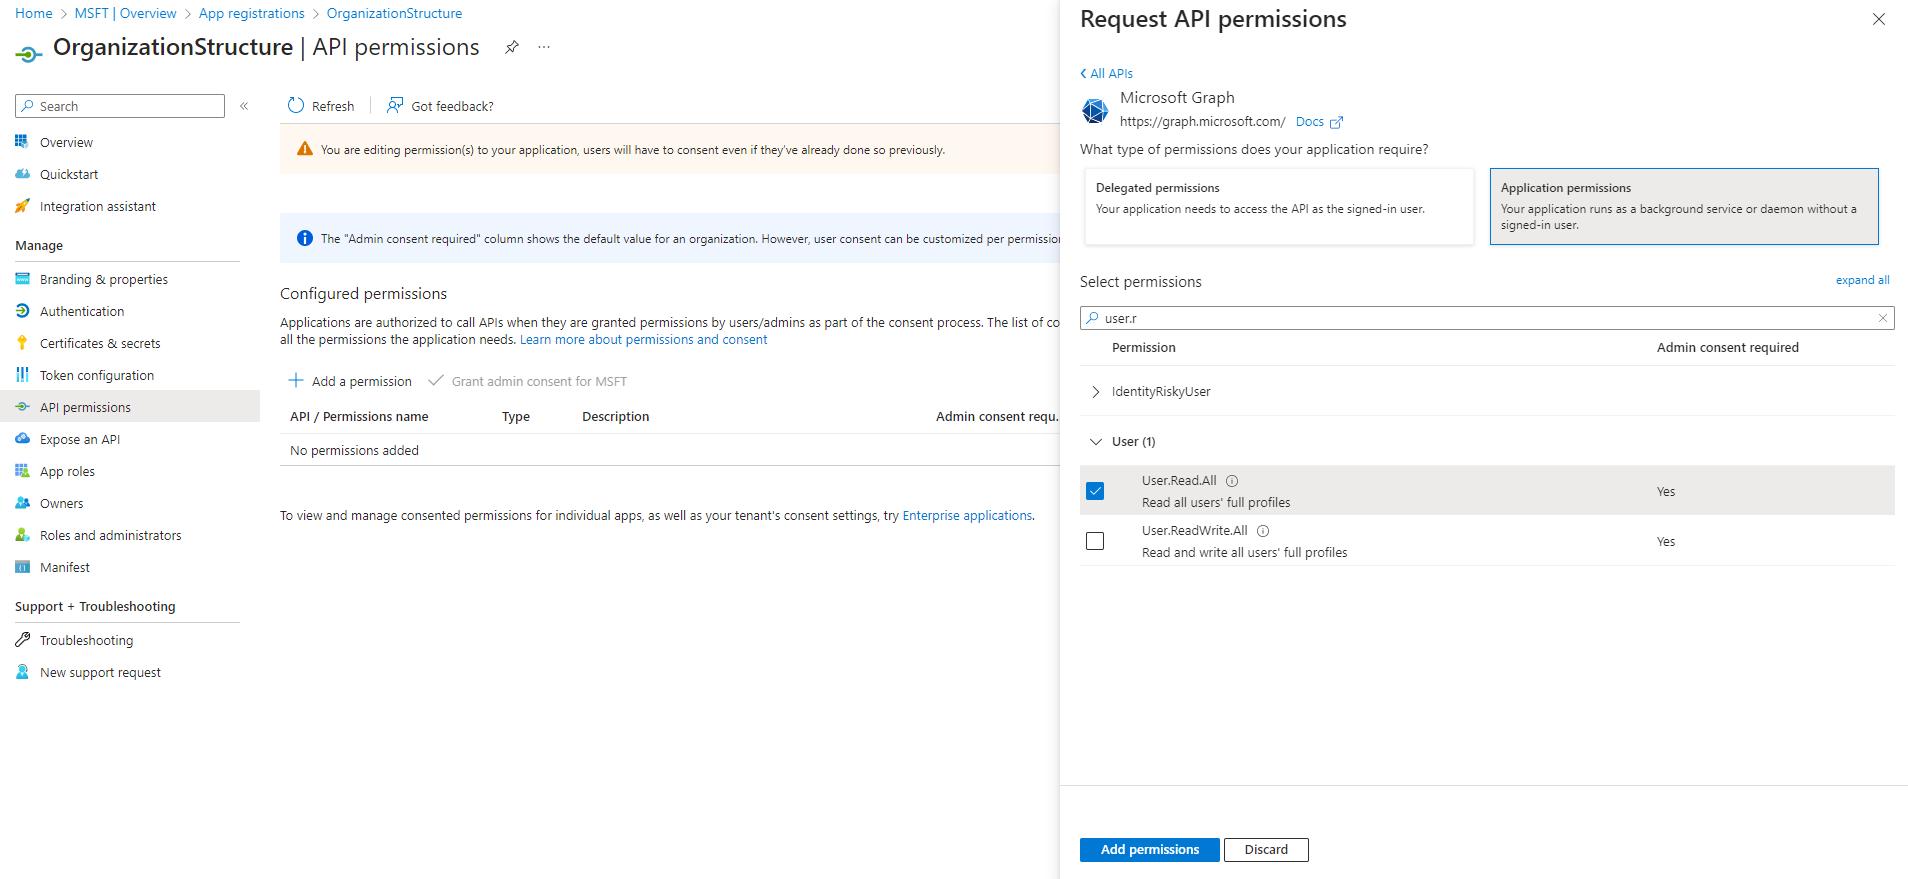
- Add the
User.Read.Allapplication permission

- Grant admin consent

- Copy tenant id, client id and client secret

.NET application
- Create a console application and add
Microsoft.GraphandAzure.IdentityNuGet packages - Create an instance of
GraphServiceClient
var clientSecretCredentials = new ClientSecretCredential(tenantId, clientId, clientSecret);
var graphClient = new GraphServiceClient(clientSecretCredentials);
- Get all users and include id of the manager
var response = await graphClient.Users.GetAsync(x =>
{
    x.QueryParameters.Select = new[] { "id", "displayName", "givenName", "mail", "jobTitle", "officeLocation", "city", "department" };
    x.QueryParameters.Expand = new[] { "manager($select=id)" };
});

var users = new List<User>();
var pageIterator = PageIterator<User, UserCollectionResponse>.CreatePageIterator(graphClient, response, (user) =>
{
    users.Add(user);
    return true;
});

await pageIterator.IterateAsync();
note: Use a filter to exclude guest users, room calendars, and other entities you don't want to include in the chart.
- Group users by a manager
var managerUsers = users.Where(x => x.Manager != null).GroupBy(x => x.Manager.Id);
- Create a
StreamWriterand write some header lines of the markmap file
using var file = new StreamWriter(outputPath);
await file.WriteLineAsync("---");
await file.WriteLineAsync("markmap:");
await file.WriteLineAsync("  colorFreezeLevel: 6");
await file.WriteLineAsync("---");
await file.WriteLineAsync("# Organization");
- Iterate through all users, starting with users without a manager
foreach (var manager in users.Where(x => x.Manager == null))
{
    await file.WriteLineAsync($"## {manager.DisplayName}");
    await WriteUsersAsync(manager.Id, 0);
}

async Task WriteUsersAsync(string managerId, int level)
{
    var mgUsers = managerUsers.FirstOrDefault(x => x.Key == managerId);
    if (mgUsers == null || !mgUsers.Any())
    {
        return;
    }
    var indent = new string(' ', level);
    foreach (var item in mgUsers)
    {
        await file.WriteLineAsync($"{indent}- {item.DisplayName}");
        await file.WriteLineAsync($"{indent}  {item.JobTitle} ({item.Department})");
        await WriteUsersAsync(item.Id, level + 2);
    }
}
Build and run the console app. The 'hardest' part is done.
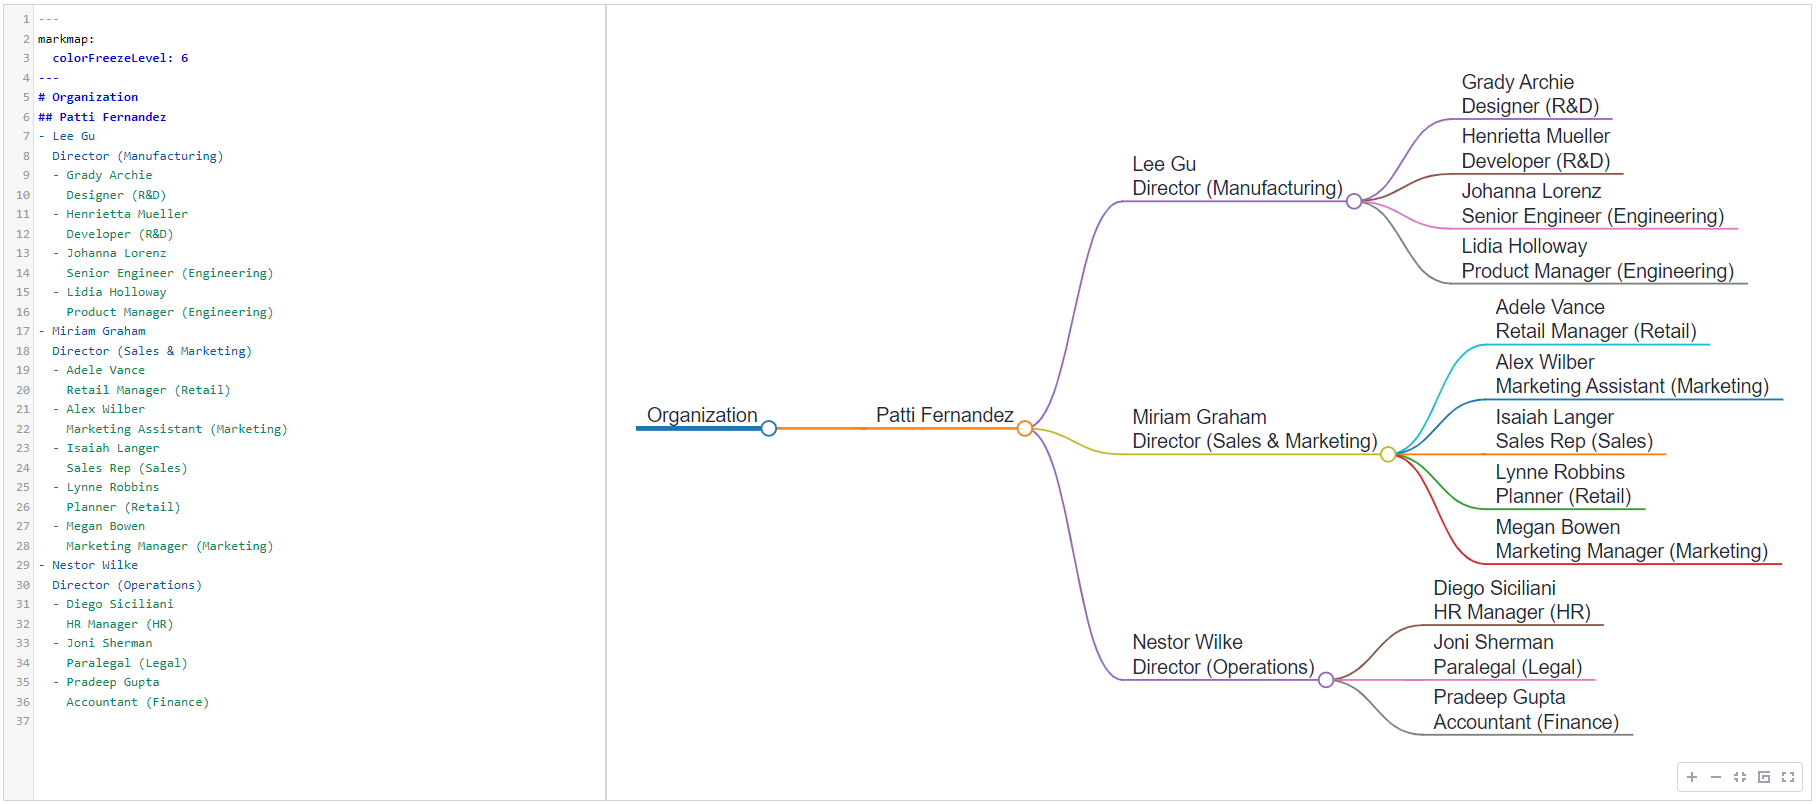
View markmap
Now, open the demo page and copy the content of generated Markdown file.

Conclusion
The markmap provides the capability to easily and interactively visualize Markdown files. The Graph API simplifies a way to retrieve data to be visualized. Combination of the Graph API and the markmap allows us to quickly visualize the organizational structure.
The source code can be found in the GitHub repo.